17.04.2026
Satellite measurements provide new insights into glacial outburst floods
New measurements of the 2021 and 2022 glacial outburst floods from Grímsvötn reveal how water spread beneath the glacier, lifting the ice over a large area. The water temporarily accumulated in extensive lakes at the glacier bed before draining from beneath the ice. The findings shed new light on how these floods develop.
The findings come from a study of the 2021 and 2022 glacial outburst floods, known as jökulhlaups, from Grímsvötn. Scientists used satellite measurements, discharge measurements in Gígjukvísl and measurements of the surface of Vatnajökull to track the movement of water beneath the glacier. The results were published in April 2026 in the scientific journal Nature Communications.
Water spreads beneath the glacier and lifts the ice
The measurements show that the floodwater initially travels along the glacier bed as a flood wave several kilometres wide. The water lifts the glacier by approximately one metre over a large area.
As the glacier lifts off its bed, the resistance to its movement decreases and the ice flows faster. During the 2021 flood, a GPS station approximately 17 km south of Grímsvötn recorded an approximately fivefold increase in ice-flow velocity.
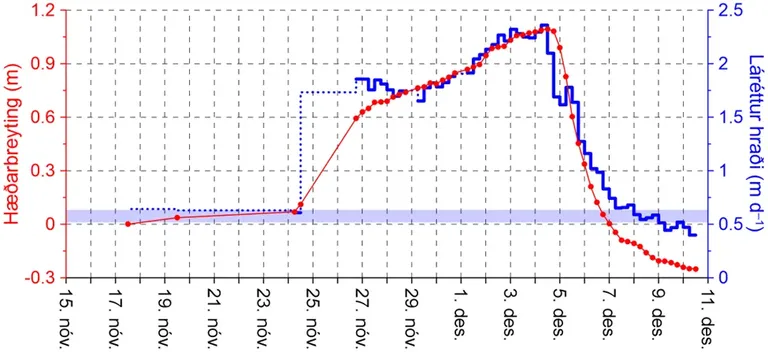
Movement of a GPS station approximately 17 km south of Grímsvötn during the 2021 jökulhlaup. The red curve shows changes in elevation and the blue curve shows horizontal velocity. The first signs of leakage from Grímsvötn were detected on 15 November. The flood wave reached the station on 24 November and the glacier terminus on 27 November. Discharge from Grímsvötn peaked at approximately 3,600 m³/s on the evening of 4 December. The light-blue band indicates horizontal velocity before the flood.
Extensive lakes form beneath the glacier
During the 2021 and 2022 floods, water accumulated downstream of Grímsvötn where the drainage system could not develop fast enough to accommodate the flow. From there, a flood wave travelled along the glacier bed to the glacier margin over four to six days. Along the way, extensive lakes formed beneath Skeiðarárjökull, draining towards the end of the floods.
The measurements enabled scientists to estimate how much water accumulated beneath the glacier. During the 2021 flood, nearly one cubic kilometre of water drained from Grímsvötn. At its peak, water storage beneath Skeiðarárjökull amounted to approximately a quarter of that volume.
In some respects, this flood-wave propagation resembles that observed in rapidly rising jökulhlaups from the Skaftá ice cauldrons in western Vatnajökull. Those floods have also been studied using satellite measurements, but their discharge increases much faster than in most floods from Grímsvötn.
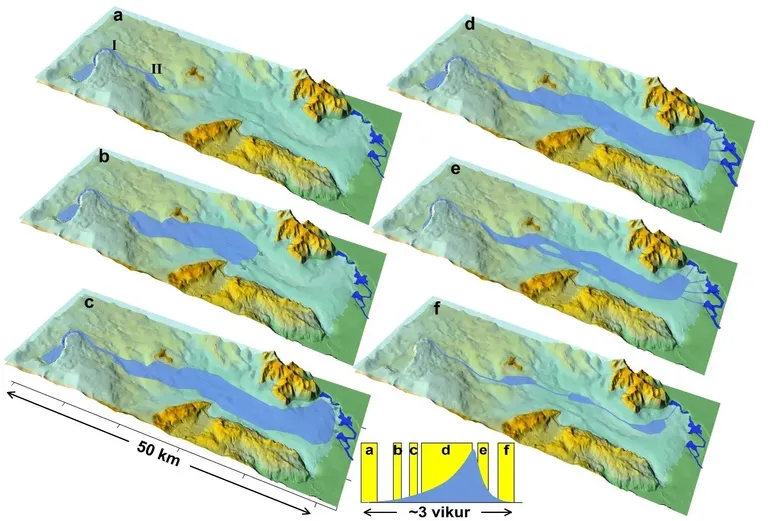
Development of a jökulhlaup from Grímsvötn, based on measurements of the 2021 and 2022 floods. Panels a–f show how water spreads and accumulates in lakes beneath Skeiðarárjökull before draining. The inset graph shows water storage and the timing of each stage over approximately three weeks. The stages are described in more detail below.
a) The flood begins. Water starts leaking beneath the ice dam at Grímsvötn and drainage conduits begin to form. Farther downstream, the drainage system cannot develop fast enough to accommodate the flow, causing water to accumulate.
b–c) A flood wave travels beneath the glacier. From Area II, where water has accumulated, a flood wave travels along the glacier bed to the glacier margin over four to six days. Its progress is detected at the surface as glacier uplift and increased ice-flow velocity.
d) The lakes expand. High water pressure continues to lift the glacier. The lakes grow to cover a large part of the glacier bed. Drainage conduits begin to form near the glacier margin.
e) The glacier begins to subside. As discharge from Grímsvötn decreases and water stops accumulating, pressure beneath the glacier falls. Uplift stops and ice flow slows considerably. The glacier then begins to subside, first in the upper part of the flood route and later farther downstream.
f) The lakes drain. Isolated but interconnected pools remain, eventually disappearing. Discharge in Gígjukvísl returns to normal.
A theory based on Icelandic measurements
Scientists have studied glacial outburst floods from Grímsvötn for almost a century. The first scientific theory explaining their behaviour, proposed by John Nye in 1976, was based on Icelandic measurements and observations of floods in Skeiðará. Among those who contributed were hydrometrist Sigurjón Rist, geologist Sigurður Þórarinsson and glaciologist Helgi Björnsson.
The theory assumed that water flowed through subglacial conduits that gradually enlarged as the floodwater melted the ice forming their walls. This can be compared to turning on a garden hose, except that the hose itself widens as more water flows through it.
The shape of outlets at the glacier margin and the increase in discharge supported this explanation. The theory’s equation describing the growth in discharge also closely matched Sigurjón Rist’s measurements of the March 1972 flood in Skeiðará.
The new measurements show, however, that conduit flow alone cannot explain the entire development of these floods. Water can also spread along the glacier bed and temporarily accumulate in extensive lakes. Conduit flow and distributed flow beneath the glacier can therefore alternate during the same flood.
Satellites detect movements of the glacier surface
Radar images from ICEYE satellites are a key source of data for the study. A technique known as radar interferometry makes it possible to measure very small movements of the glacier surface between observations. These movements provide evidence of how water advances and accumulates beneath the ice.
Similar measurements are also used to monitor volcanoes, crustal movements and landslide-prone slopes.
The research was carried out by scientists at the Institute of Earth Sciences at the University of Iceland, the Icelandic Meteorological Office, the Natural Science Institute of Iceland, ENVEO IT GmbH in Austria, ICEYE Oy in Finland and the University of Toulouse in France.
Water spreads beneath the glacier and lifts the ice
Extensive lakes form beneath the glacier
A theory based on Icelandic measurements
Satellites detect movements of the glacier surface